Dynamic Risk Management
[29/05/26]
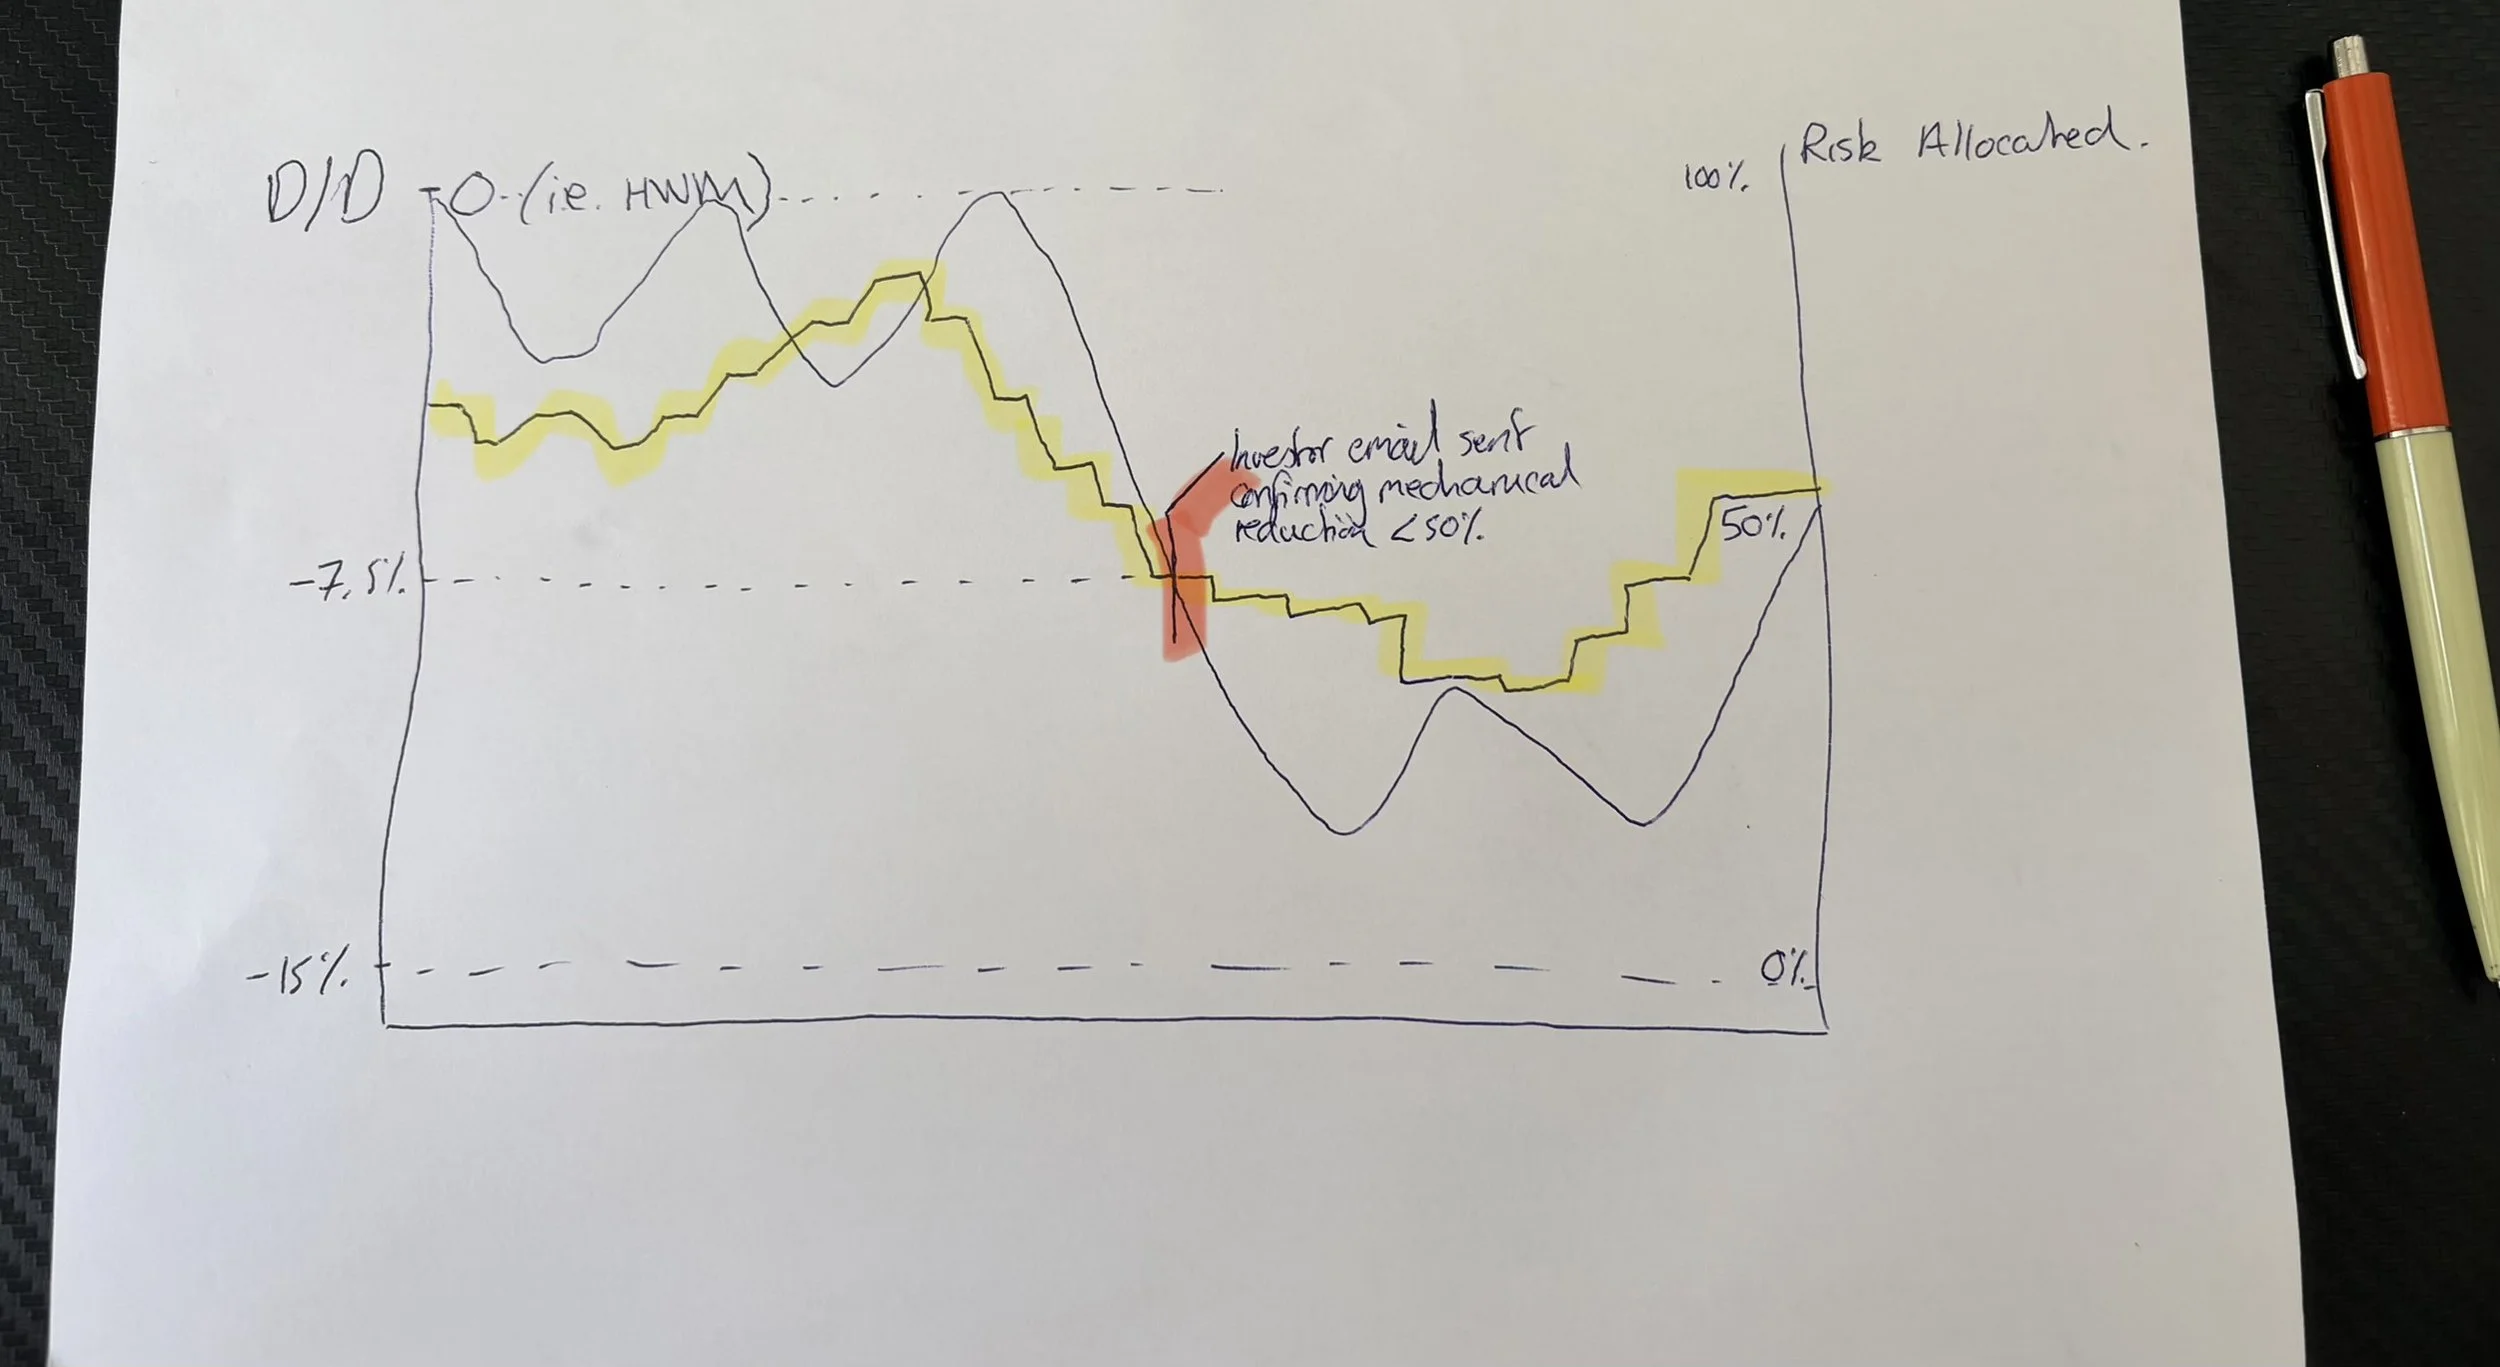
A scribble to clarify a message during a conversation with the CIO of a futures firm warrants circulation, as this is without doubt the most valuable thing I have learned since stepping out of a bank trading seat. Before I jump into the explanation; the essence is that controlling the yellow line, rather than being controlled by the yellow line and told when to shift it, is risk management in a nut shell. A mediocre trader with a hit rate close to 50% will still produce an upward-sloping P/L curve over time, if levels are adhered-to on a trade-by-trade basis and the yellow line is carefully controlled on a portfolio basis. There is comfort in that. I believe that thinking about a trading account of any size in the following way is the one factor segregating retail from professional trading, and that sell-side traders are forced via daily risk management metrics to morph their framework and think in this way at any prop trading or buy-side institution AFTER the move and whilst bedding-in. I learned this the hard way, in all honesty.
In the chart below, the LHS axis measures your drawdown (D/D) as a % of your allowable drawdown (distance to portfolio stop loss). The solid, smooth black line charts this. A D/D of 0% implies that you are at your trading P/L high-water mark for the year. A D/D of -100% implies the entire AUM or available trading capital is lost - clearly a complete disaster and very rare that any drawdown of 20-30% or more is institutionally tolerable, which is why I highlight the importance of retail traders - without strict risk management departments and likely using heavily leveraged accounts - think in this way at the full traded notional level (more to come). The shift in thinking here is that the trading account P/L need not be drawn nor made main focus, and caters for itself, providing the drawdowns are controlled. The RHS axis, corresponding to the stepped yellow line, represents risk deployed in % terms. 100% is full allocation, whereas 0% represents a flattening of the book. Institutional traders can think of this as VaR usage (again, this is why the transition from bank trading can be tricky, as VaR metrics are usually only applied at desk level, as opposed to individual trader level, and instead risk is measured in $ notional terms or P/L terms on more linear desks). Retail traders can of course think of this as margin usage or futures ‘buying power’ in % terms. When trading a margin or leveraged account, the absolute level of risk deployed in % terms will at times be high, as you utilize leverage (RHS axis). For example, my account is 10x leveraged. Therefore, if I deploy 100% of my available capital, I will be 10% fund AUM deployed.
Most multi-manager hedge fund PM seats will include risk metrics in the form of a ‘soft’ stop loss (in this case -7.5% for demonstration purposes) and a ‘hard’ stop loss (-15%, here), at which point it is pre-agreed that the strategy may be liquidated and all risk cut. Emerging managers can also pre-define these risk metrics and the mechanics behind them, to demonstrate discipline to allocators. I urge all retail traders to therefore track their risk in the same way.
Even if you trade in a disciplined and ‘game of inches’ way, as I try to demonstrate on the Macro Blog, a string of losses as you struggle with a macro view or a market geopolitical/liquidity event resulting in slippage can see your trading P/L near your drawdown budget. Here, I depict the playing-out of a mechanical and pre-agreed process of how the PM manages her/his risk as she/he approaches the ‘soft S/L’ or action-point of a -7.5% D/D from their high water mark. The mechanical agreement that one would have with themselves at the least, or likely with their risk management department and in their contract, is that their risk will be reduced by 50% should their trading P/L hit their ‘soft’ S/L (-7.5%). The discretion lies within this step function. In theory, said PM could be running at 100% risk allocation as the portfolio fell from HWM > -2% > -5% > -7.49% and then ONLY once -7.50% had been breached, would they contractually have to cut their risk allocation from 100% to 50% in a step function. This is heavily irrational and irresponsible - however in the moment, with a strong view and during a ‘fast’ sentiment shift, you would be surprised how rational it can feel! Better risk management, for all parties involved - not least the mental capital preservation of the trader in question, as well as the monetary capital of the account - is to manage the yellow line in less of a binary step function and more of a smoothing process. You likely have many trades on at once and limited concentration risk, which helps to smooth the line in itself, as all stops on individual trades are unlikely to be hit at once, but being hyper-conscious of the gradient and absolute level of the yellow line is the sole way of maintaining complete control over the situation and the necessary psychological management. Reducing risk during a drawdown, with the yellow line lagging the black, but falling in sympathy, then likely leading the black higher post-trigger-point, as views are reassessed and bleeding is stemmed, is the survival technique that takes many years to learn. Once the black line recovers the trigger point though process maintenance and discipline, the yellow line can recover >50% once more in a dynamic fashion and not a step function; protecting against ‘getting carried away’.
Conclusion: multi-cycle survival comes from controlling the yellow line. Allocators, risk managers and department heads want to see proof that you are controlling the yellow line. The steeper the yellow line, and the more it looks like a step-function, the less control you have over the gradient or rate of change of your P/L line, best defined by your drawdown budget. Sure, if the yellow line is too low in absolute terms you will be under-deployed and struggle to hit P/L targets. If the yellow line has too shallow a gradient and too low an amplitude, then you are likely not spiking your deployment enough when you have a strong view; demonstrating conviction and discretionary opportunism. There is a comfortable middle ground; the point here is to facilitate a survival framework so that the trader finds their own comfort zone.