Setup Series #1
[01/12/25]
I will save the debate surrounding the merits and application of technical analysis for another time/post, but a fitting starter for this series of trade setups is the use of lateral/horizontal support and resistance levels to dictate range breaks and identify trading opportunities. Exploring this foundational theory as I believe it to be a solid starting point, with no prior macroeconomic knowledge necessary. I am focusing on lateral support and resistance levels, as opposed to upward/downward sloping trend lines and channels. The logic is that the former are easier to recognise, are often strong signals and can be monitored clearly on either an intraday or closing basis. A clear strategy and parameters can be set around them, with little debate as to the levels.
One aspect to consider here is the mechanics of the setup, i.e. what is actually happening. At a certain price point, a single buyer(seller)/group of buyers(sellers) are transacting in a way that prevents a further movement in the price, which then reverses. There is no visual difference between a self-fulfilling setup (i.e. herd mentality of market participants and systematic traders aligning to engage repetitively with buying/selling of the instrument at a certain price point) and an orderflow setup (one large market participant transacting at a certain level - for example a corporate or central bank). Crucially - despite the pattern recognition, charting analysis and trade execution being identical and therefore differentiation irrelevant, it can be argued that you are more likely to successfully trade around the level if it is of the orderflow variety. A brief moment in the multi-trillion dollar market puzzle, in which activity is sufficiently large enough to unveil one piece of that puzzle. Therefore, important to know that when monitoring an index or basket into these levels (eg, BBDXY ‘dollar index’) it is harder to rationalise the continued rejection of a specific level as an ‘orderflow setup’. However in a single transacted product (i.e. EURUSD, single stocks, copper futures) or an equity index that is traded as a product itself in futures form (i.e. Nasdaq), then this mechanical orderflow can absolutely be the reason for the price congestion, followed by an impulsive break. There is, therefore, logical reasoning behind trying to identify these set-ups in specific traded cash instruments as you familiarise yourself with them, as opposed to baskets. A) the chance of identifying an orderflow-level is higher (more impulsive move through the level once the order is filled and B) the instrument to directly implement your trade idea is both liquid and accessible via most brokers, as opposed to trying to construct your own basket or synthesise the product.
Upon recognition of the level (3x hold of a single price point or channel, for example), trading setup can be take many forms, with the common thread being risk-reward. Let’s assume the level we are monitoring is a support level.
1) Buy ahead of the support level. Cut on what you consider to be a ‘clean/true break’ of said support level. Ensure the target take profit (TP) level ensures the risk of the potential loss between your entry level and your stop loss (SL) on break confirmation is worthwhile.
2) Wait for your confirmed break level to be breached, then sell through this level. Set a SL level where you deem the break of support level to be invalidated; this is your risk. Set an appropriate TP level and target for the trade.
3) Buy above; flip short beneath. This requires much higher confidence that the level is crucial. The first component of the strategy is a mean-reversion play. The former is a break-out play. The support level is the pivot for regime change and you’re approaching the market with the view that the level is SO important that either OR both strategies will work.
A great book on this is titled Way of the Turtle: The Secret Methods that Turned Ordinary People into Legendary Traders. C Faith, 2007. It’s probably not worth reading the entire book (a trading reading list to follow), but I think researching a precis of this style of trading that is a very systematic and simplistic method of recognising and monetising range breaks would be helpful. The book, written by a subject of a 1983 systematic trading experiment, details the systemising of a simple trend-break strategy and demonstrates that this setup can be deployed with minimal financial markets background or cross-asset analysis. A rudimentary form of algorithmic trading strategy.
Workable examples:
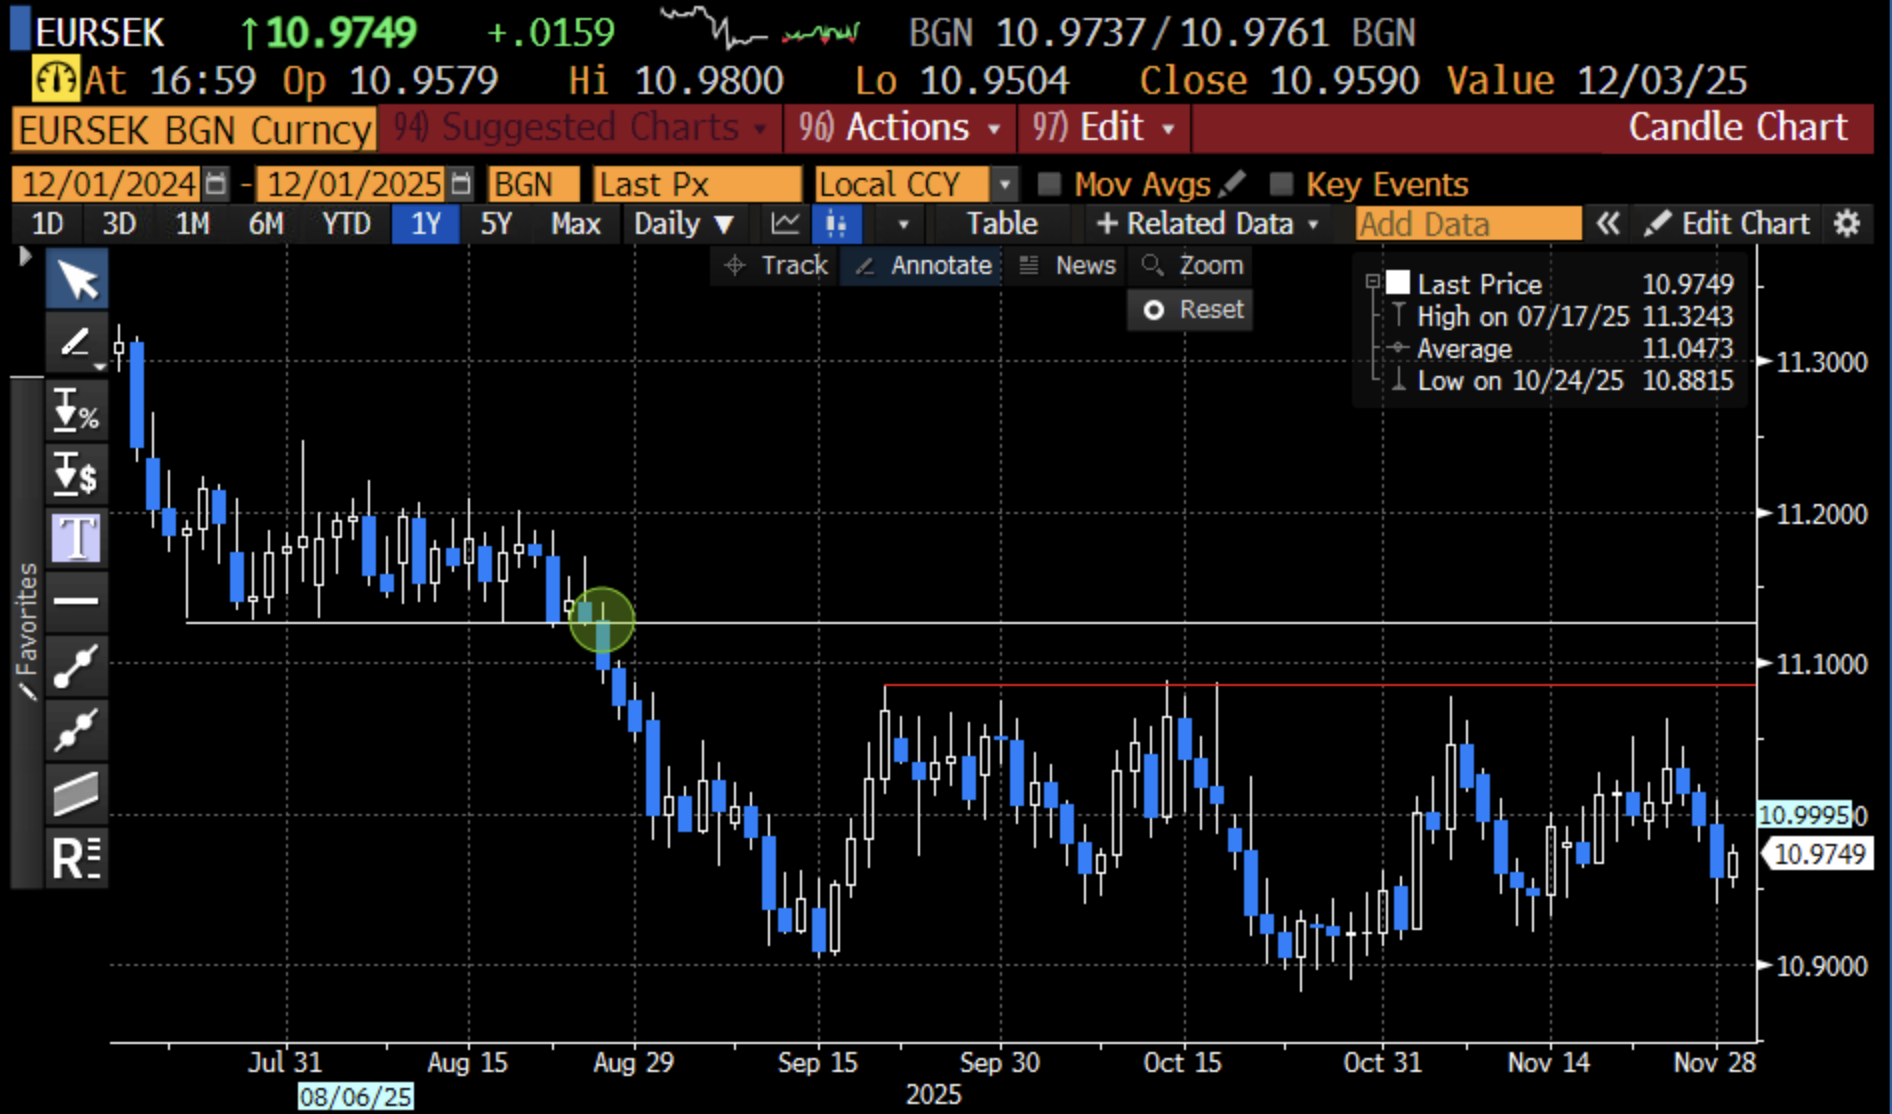
EURSEK 11.12 lateral support break, followed by formation of 11.09 resistance. Strategy 2 effective.
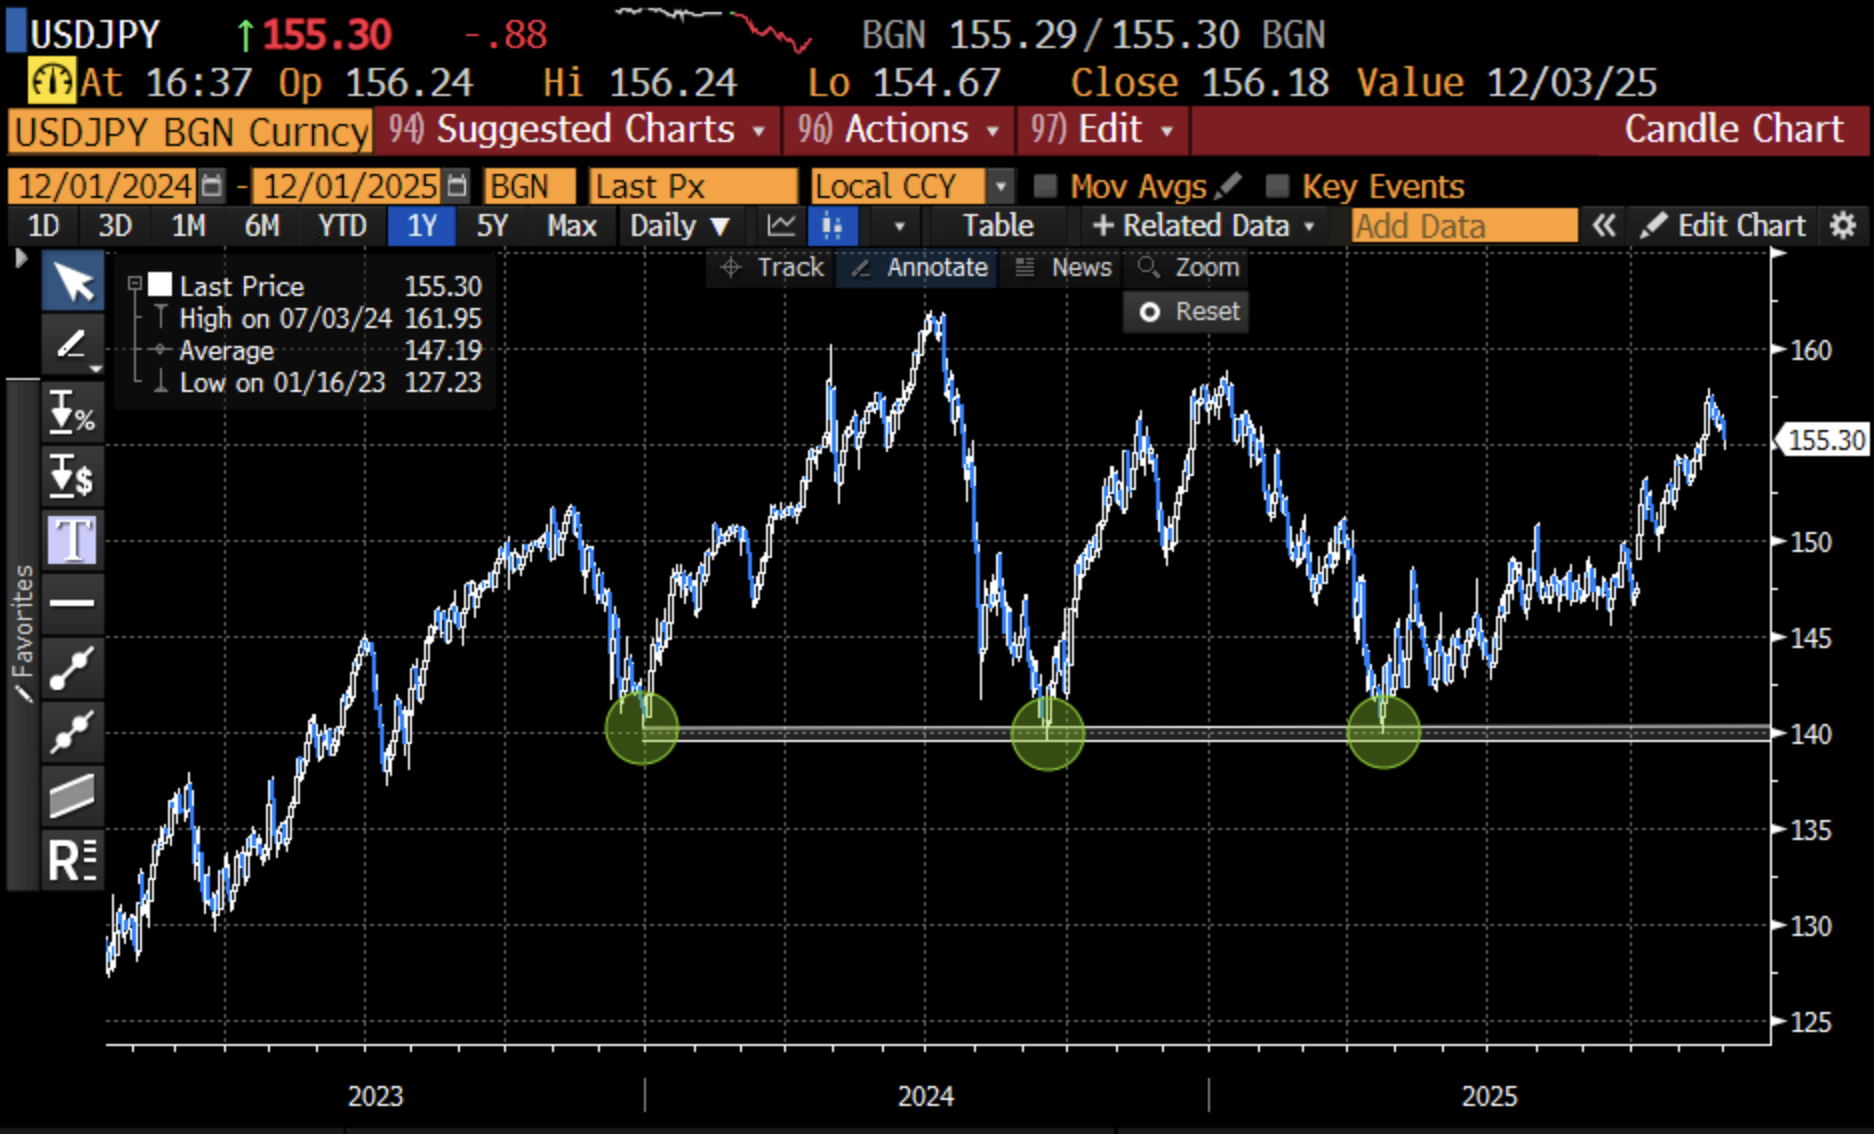
USDJPY longer-term band of 139.57-140.25 holding 3x as major support. Strategy 1 effective.
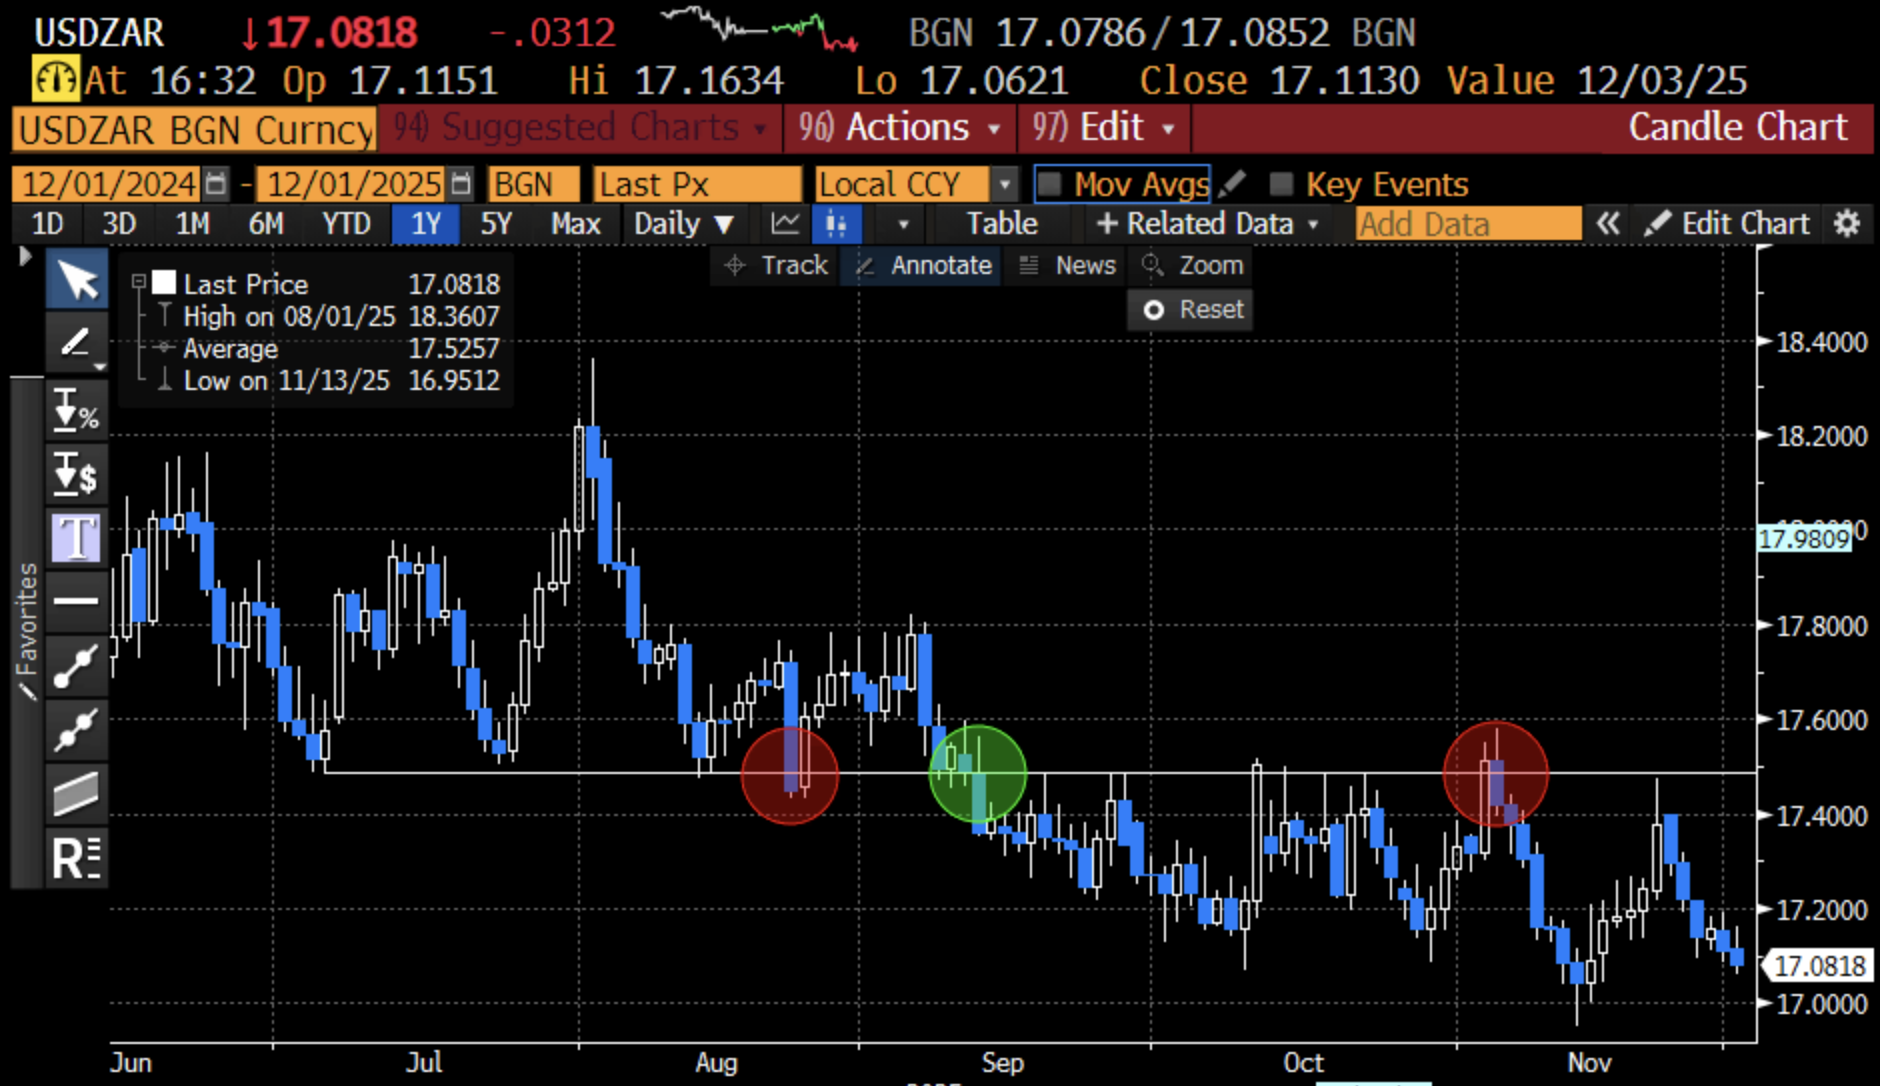
USDZAR 17.50 pivot with 2x false breaks highlighted; otherwise holding. In this example, Strategy 3 would have been problematic.